Libertarian Voter Data Access
Please enter the password to view the data:
Libertarian Voter Distribution Maps
The following maps show the distribution of Libertarian voters across the United States based on the January 2025 L2 Voter File.
Libertarian Voters by Zip Code
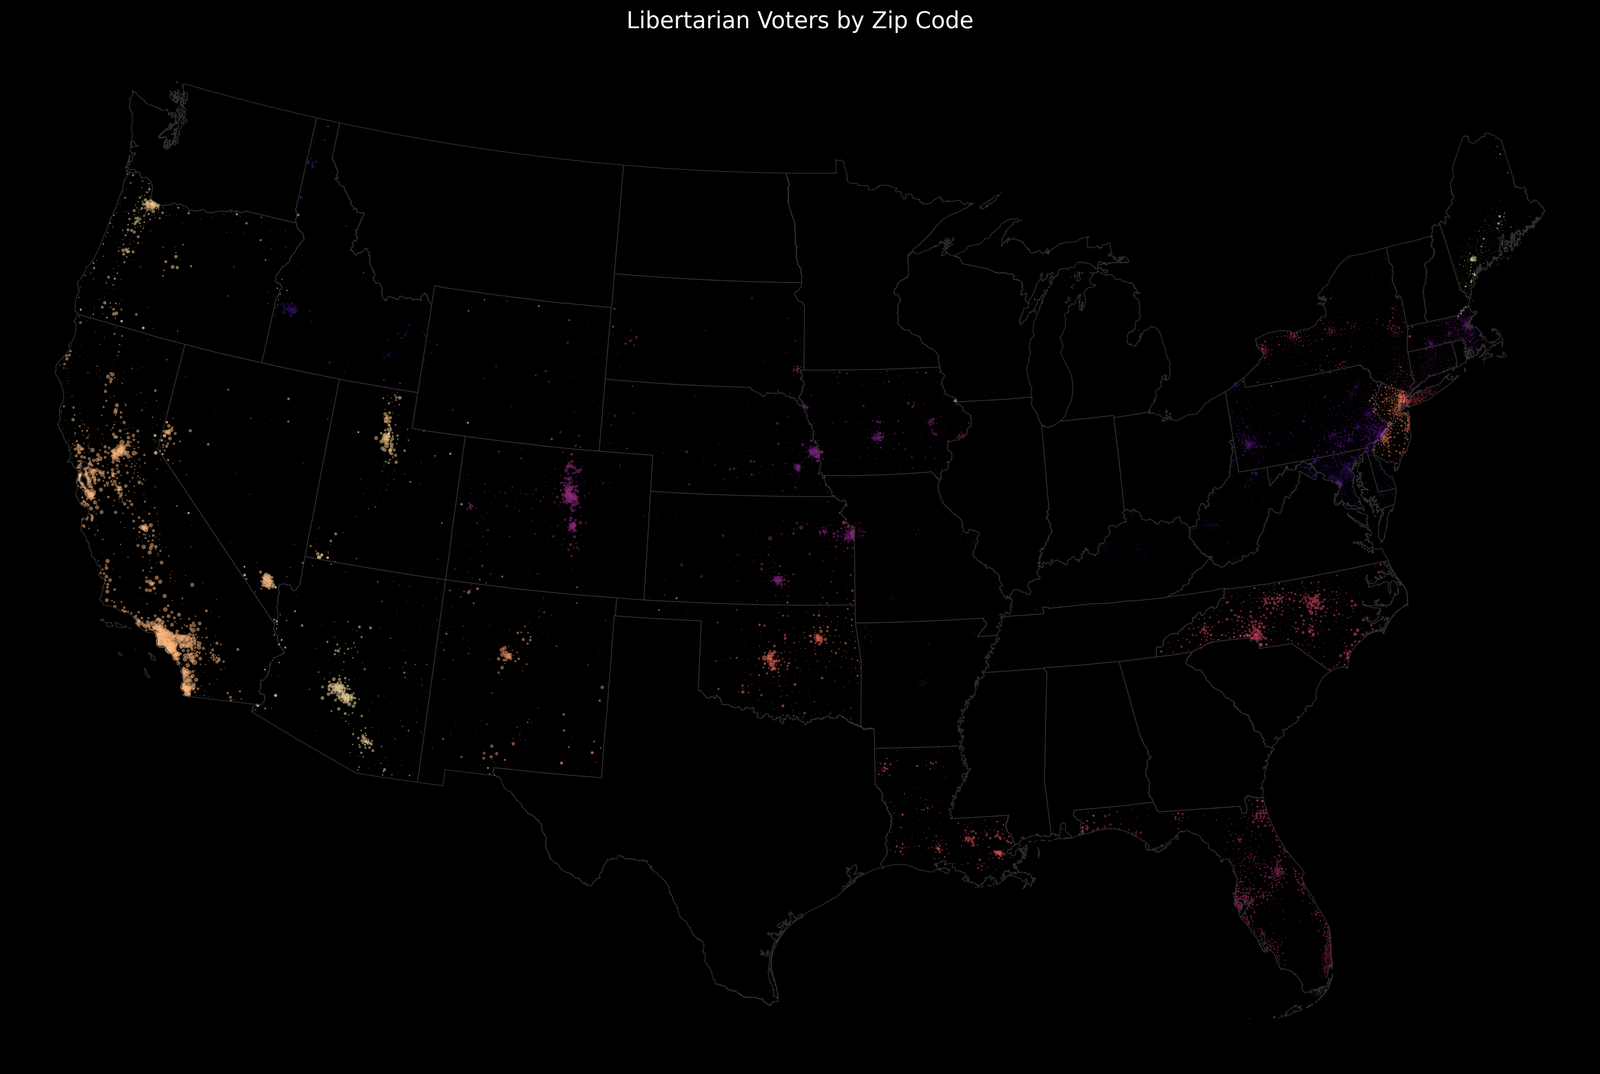
Detailed view of Libertarian voter distribution at the zip code level, showing concentrations in urban areas and the Western United States.
Regional Membership Distribution (Raw Numbers)
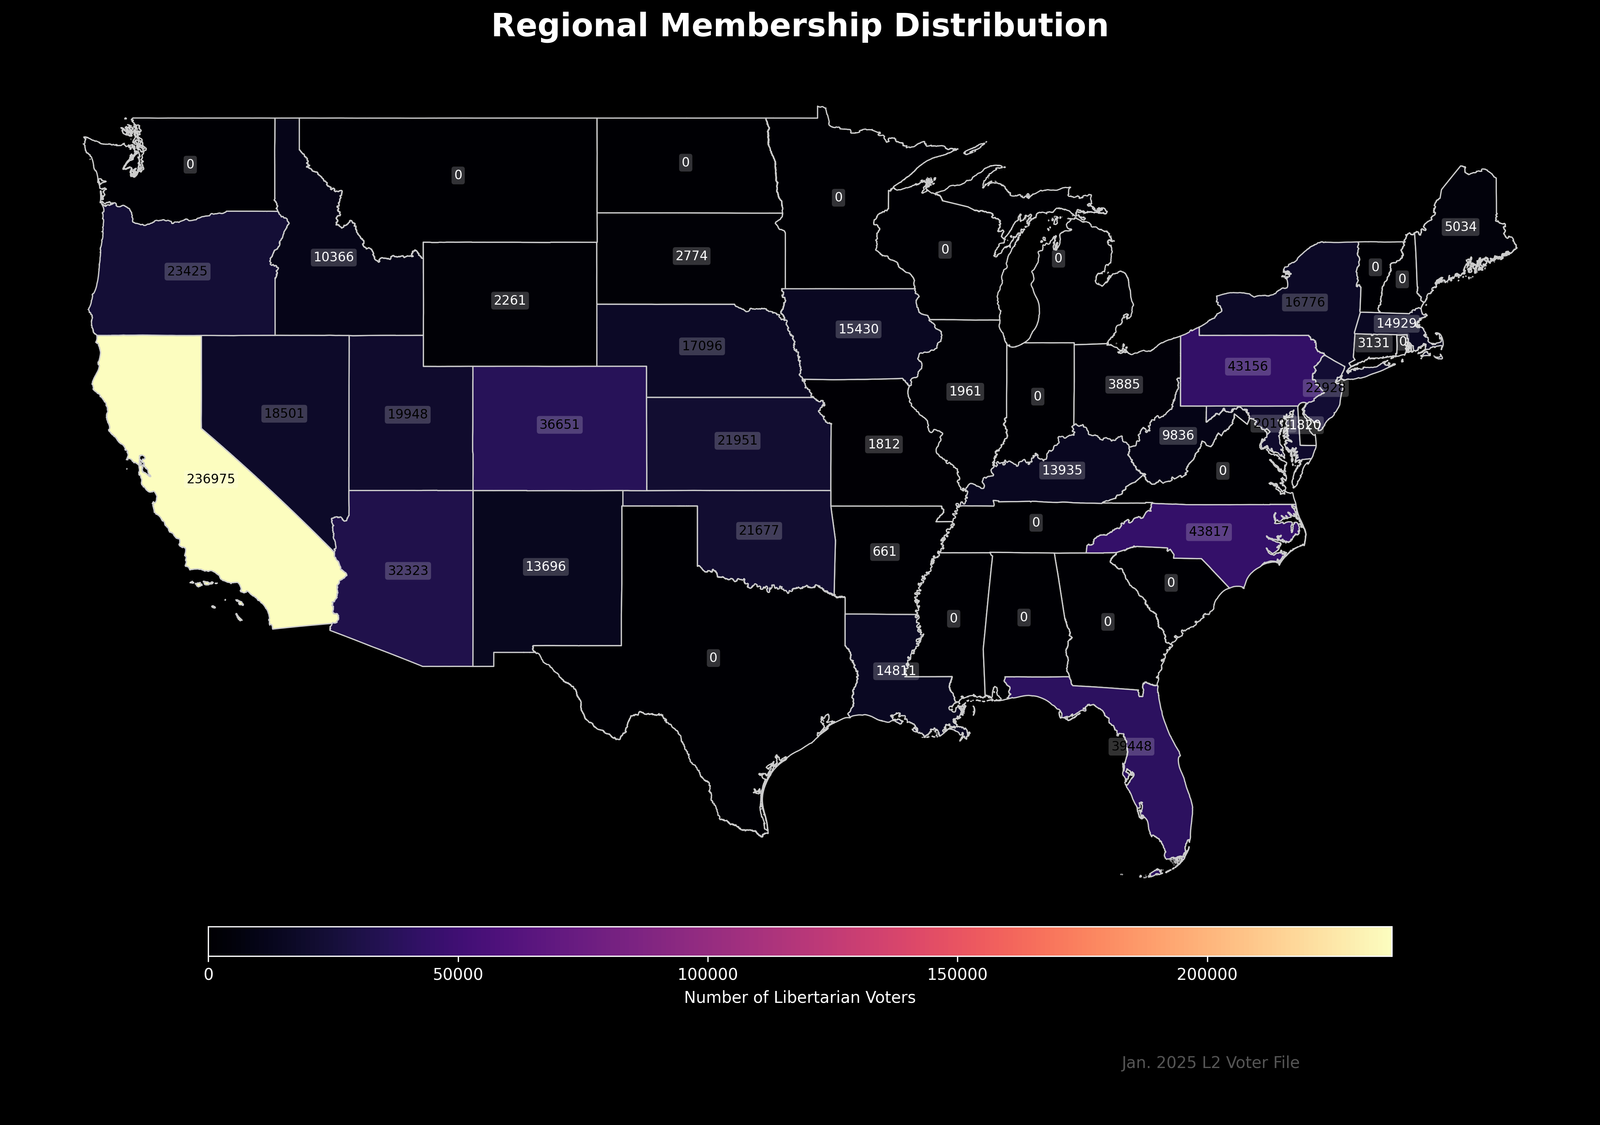
Distribution of Libertarian voters by state (absolute count). California leads with 236,975 voters.
Regional Membership Distribution (Relative Frequency)
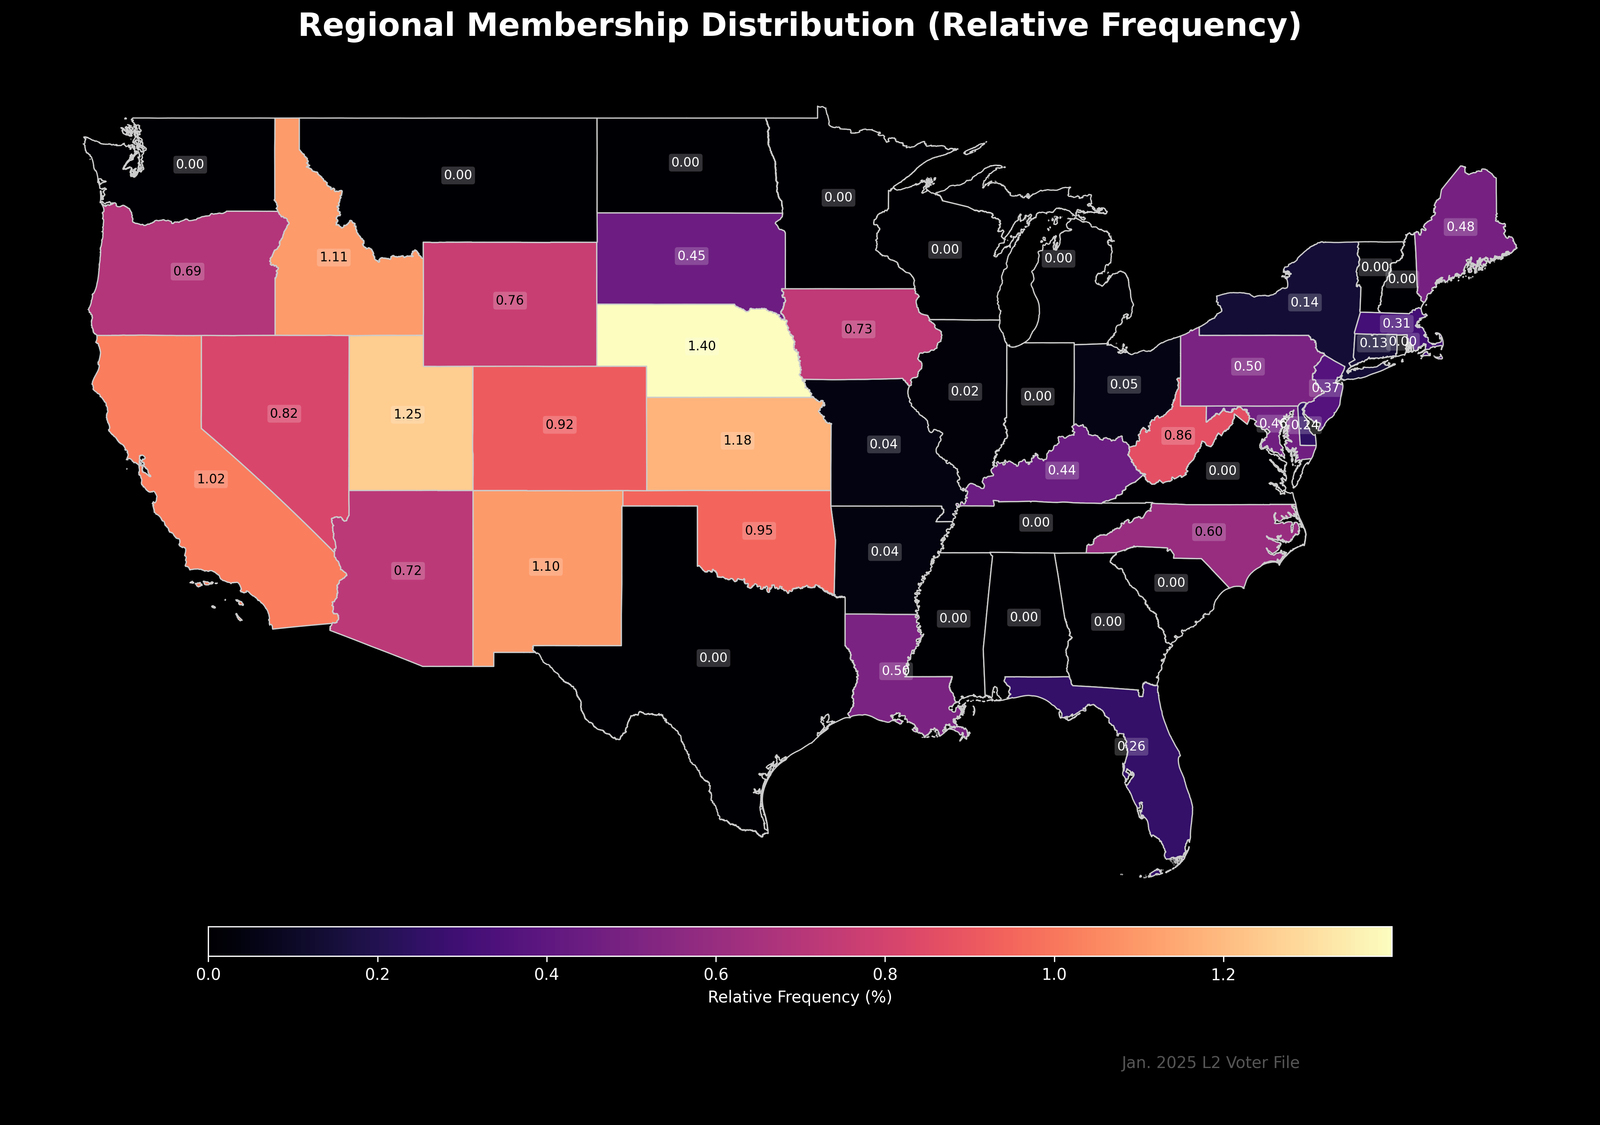
Percentage of voters registered as Libertarian by state. Nebraska shows the highest relative frequency at 1.40%.
State-by-State Libertarian Data
| State | Voters | MAIDs | Cells |
|---|---|---|---|
| AK | 6,430 | 2,664 | 2,051 |
| AR | 661 | 321 | 449 |
| AZ | 32,323 | 14,919 | 23,035 |
| CA | 236,975 | 148,733 | 141,920 |
| CO | 36,651 | 17,758 | 24,710 |
| CT | 3,131 | 1,737 | 2,208 |
| DC | 2,181 | 681 | 781 |
| DE | 1,820 | 947 | 902 |
| FL | 39,448 | 23,525 | 25,263 |
| IA | 15,430 | 7,942 | 7,425 |
| ID | 10,366 | 4,205 | 5,278 |
| IL | 1,961 | 1,398 | 1,279 |
| KS | 21,951 | 10,675 | 15,494 |
| KY | 13,935 | 5,023 | 5,303 |
| LA | 14,811 | 7,574 | 9,240 |
| MA | 14,929 | 7,934 | 6,668 |
| MD | 20,101 | 10,086 | 8,156 |
| ME | 5,034 | 1,889 | 1,357 |
| MO | 1,812 | 902 | 805 |
| NC | 43,817 | 19,425 | 26,816 |
| NE | 17,096 | 8,652 | 8,055 |
| NJ | 22,928 | 11,921 | 10,650 |
| NM | 13,696 | 6,244 | 5,722 |
| NV | 18,501 | 8,363 | 12,041 |
| NY | 16,776 | 8,872 | 7,077 |
| OH | 3,885 | 2,631 | 2,021 |
| OK | 21,677 | 8,635 | 7,899 |
| OR | 23,425 | 10,946 | 10,606 |
| PA | 43,156 | 23,341 | 29,447 |
| SD | 2,774 | 1,316 | 2,231 |
| UT | 19,948 | 8,427 | 11,552 |
| WV | 9,836 | 4,222 | 3,329 |
| WY | 2,261 | 905 | 705 |
State-by-state data showing Libertarian voter counts, Mobile Ad IDs (MAIDs), and cell phone numbers available.
Key Insights
- California has the highest absolute number of Libertarian voters at 236,975
- Nebraska has the highest percentage of Libertarian voters at 1.40% of registered voters
- Strong concentrations appear in Western states, particularly in California, Nevada, Colorado, and Arizona
- The Northeast corridor also shows notable concentrations, particularly in Pennsylvania and New York
- North Carolina (43,817) and Pennsylvania (43,156) have the second and third highest voter counts after California